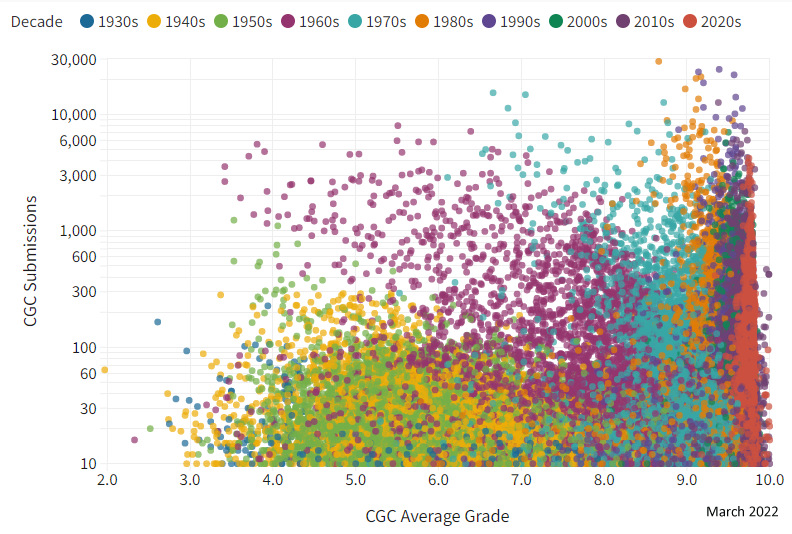
Imagine a game where 1,000 lucky collectors are awarded prizes from the CGC Census. Winning ticket #1 would receive the best CGC graded copy of Action Comics #1, Detective Comics #27, and Amazing Fantasy #15, but there are thousands of comic book collectors. What prizes would winner #1,000 receive?
Continuing the exploration of the CGC Census, this month the focus is second issues. Most titles see a significant decrease in both the value and the number of CGC submissions for issue #2 when compared to issue #1.
There are 232,766 different comic books graded by CGC on the CGC Census (April 19, 2022). There are 50,048 different comic books graded by CGC are a #1 issue (21.5%). The total number of submissions on the CGC Census is 7,444,146, with 2,159,016 as #1 issues (29%). For #2 issues, 14,592 different comic books have been graded by CGC (6.3%). The total number of submissions on the CGC Census for #2 issues is 318,492 (4.3%).
CGC has graded 76,832 issues at least ten times each for a total of 6,835,678 submissions, which represents more than 93% of all CGC submissions. Outliers on a decade color-coded chart show books that “stand out” from the others. Of course books like Amazing Fantasy #15 and Fantastic Four #1 are standouts from the 1960s, but what about other standouts with unusually high average grades?
Explore any of the 76,832 dots, if you have the time, or see a few outlier issues in each decade.
Most submitted book to CGC for each month in the 1970s…
Many comic collectors associate comic books with particular dates in their lives. In message boards and social media, users may post a photo of a “birthday comic” with a caption reading, “from the month I was born.” Using the CGC Census data, it is possible to identify the most often submitted comic book to CGC for each month and year for almost 90 years.
It has been said that investing in CGC graded modern books should be CGC 9.8 or nothing. Does that advice hold up to testing? What do 2005 prices look like in 2021? Could the best rate of return be (MUCH) lower on the CGC grading scale? Yes it can!
GPAnalysis reports how many copies sell for individual issues and there may be few surprises when the most often CGC graded comics are also the most often sold. But turn those numbers into percentages and the surprises abound. Take a look at the most recent twelve months in terms of what’s trading more often than you might expect.
Before the introduction of the direct market in the late-1970s, every comic book was a “newsstand” edition. Comics published from the 1930s to the late-1970s were all newsstand editions, which meant three things: 1) They could be returned for credit if they didn’t sell by a certain date, 2) They were not ordered according to demand, but according to distributor processes, and 3) both serious and casual comic collectors obtained copies of identical comic books, since all books were newsstand editions.
With the introduction of the direct market, comic book publishers were able to supply comic shops with exactly the number of copies of each book that the retailer purchased. Additionally, in exchange for a discount on the price of each comic book, the direct edition books could not be returned for credit. Comic shop owners could decide which books would sell best, which books would be good to keep in the back issue inventory, and which books they didn’t want to purchase at all.
Amazing Fantasy #15 sets world record, but thousands of copies are average.
The CGCAMC – Average Market Capitalization introduced in a series of articles during 2020 has been taken to the next step, an Estimated Market Capitalization (EMC) that includes the premiums paid at the highest end of the CGC market. Compare any two comics across ages and genres for their total CGC graded valuation – or at least an estimate that doesn’t take 100 calculations per book.
Every comic book is high grade, mid grade, or low grade – even if collectors have different personal definitions for those categories. Picture this: Using the CGC Census, it is possible to visualize what has been CGC graded so far, and perhaps discover clues about what grades remain to be CGC graded (or not!) in the future.
The CGC Census has been reported throughout the 21+ year history of CGC grading, beginning January 1, 2000. Using end-of-year CGC Census totals from CGCdata.com, the history of CGC can be summarized as:
History of totals on the CGC Census
Having this many points of data allows for a calculation that “predicts” the CGC Census numbers based upon the amount of time which has passed since CGC began grading.
That formula result is a little “ugly” to look at, but it works very well for the first 21+ years of CGC’s history.
Y = 0.00000000505*X^4-0.0000585*X^3+0.250095*X^2+5.88495*X
Where X is the number of days since January 1, 2000.
If the formula continues to be similarly accurate, the following numbers would be expected for the end of 2021 through 2025.
This is a significant increase predicted, nearly doubling the 21.5 year CGC Census totals of January 2000 to July 2021 in the time span of just 4.5 years from July 2021 to December 2025. However, the CGC Census did double most recently in just 5.5 years from December 2016 to July 2021.
Can calculating the average universal CGC grade tell us anything about how many copies of the book may still exist? Probably not! But don’t tell that to the first appearances of Superman, Batman, and Robin! Is it just coincidence, or is there a data discovery on the horizon?
Top 25 Most Submitted to CGC by Decade – The 1930s
Take a closer look at CGC submissions in five-year blocks over the past 20 years. The latest article in the CGC Census history series breaks the numbers down as Top 25 most submitted by decade from comic books of the 1930s to the 2010s. Action Comics #1 and Detective Comics #27 dominate, right? Not exactly. The CGC Census has fewer copies of those books than you might expect, especially compared to other books of the same age.
Read the full article with Top 25 lists for each decade here.
This month’s article steps through time in five-year blocks, looking at the CGC Census for books graded during 2000-2005, 2006-2010, 2011-2015, and 2016-2020. The Top 25 for each of the five-year timeframes do have many of the same books, however, these are separate lists isolating the books graded by CGC during those five-year spans and not a running total since CGC began. The Top 25 for the whole timespan from 2000-2020 is presented at the end of this article.
Starting with the Top 25 CGC Submissions for 2000-2005, the results for the first five years (technically a little over six years, from late 1999 until the end of 2005) have Wolverine Limited Series #1 as the most submitted book to CGC in the timeframe.
Most submitted books to CGC between 2000 and 2005.
Read the full article for free and see the Top 25 lists on GPAnalysis.com.
The first CGC graded comic book was Walt Disney Comics & Stories #1 (Dell Publishing, 1940) – CGC Serial #0000001001 (Invoice 0000001, Item 001), originally graded November 9, 1999. CGC opened to the public on January 1, 2000, bringing the “slab” concept from coins and cards to the comic book market.
Take a closer look at CGC’s first 100,000 graded comics.
The first comic books submitted to CGC provide a “snapshot” of the state of the comic book market and CGC as it was during 2001. The market seems to have moved on from the “hot new books of the day” from 2001, but CGC is still spending lots of time grading “hot new books of the day” in 2021. Does our past show us our likely future?
The third article on the topic of CGC Average Market Capitalization (CGCAMC).
The CGC comic book market was significantly impacted by the events of 2020, so much so that the final 2020 list for the Top 25 comic books by CGCAMC calculation is nearly 25% higher than the mid-2020 list. For the first time, Action Comics #1 and Detective Comics #27 are not in the Top 3, replaced by more recent key issues with higher CGC populations. Is this a reflection of a price bubble or a reflection of the books valued more by the market?
Multiply the average price for the average CGC grade by the number of CGC graded copies and you get CGCAMC – a simple calculation that allows any two comics to be compared on roughly equal footing. Looking back five and ten years, it’s possible to see trends in the market and fascinating to see comic books from the 1980s compete head-to-head against comics from the 1930s. Enjoy multiple Top 25 lists in this month’s article with all the calculations done for you.
When the headlines say, “COMIC BOOK SELLS FOR OVER $3,000,000!” it is certainly an attention-grabber. It is not hard to name the most valuable comic books of all. Do those highest priced comic books truly represent the most total market value for an issue? Would it be better to have 2 copies of a comic worth $100,000 each or 50 copies of a comic worth $5,000 apiece? Don’t worry – the math is already done for you, and the results may be surprising when you see the Top 25 comics calculated with CGCAMC.
This article is Part 4 in a continuing series. Part 1, Part 2, and Part 3 are linked. In previous articles, it was established that books like Amazing Fantasy #15 (1962), Incredible Hulk #1 (1962), and Fantastic Four #1 (1961) – which are submitted to CGC in all conditions – provide a better representation of what conditions might be expected to exist for other comic books of the same age, even if they are never submitted to CGC. Additionally, the percentage of restored books on the CGC Census may be representative of the time period, reflecting attempts to improve a comic’s appearance over the past six decades.
In previous articles, it was seen that there is a significant financial incentive to submit even the lowest grade copies of certain books like Amazing Fantasy #15, and the CGC Census grade distributions for Amazing Fantasy #15 are likely to be a good representation of all existing copies of not only Amazing Fantasy #15 but perhaps all 1962 comic books as well. Looking beyond 1962, Fantastic Four #1 (1961) and Avengers #1 (1963) enhance the evidence for the grade distributions of comics books from early 1960s in different ways. How many of these books are CGC 9.0 today? Perhaps just 1%, and the answer to the restoration question might surprise many collectors who never touched their raw books but can’t be too sure about their books’ previous owners 50+ years ago.