The following post contains the Overstreet Market Report supplied to the Overstreet Comic Book Price Guide #49, published in July 2019.
GREG HOLLAND
slabdata.com
Despite the increasing attention placed upon slabs (third party professionally
graded and encapsulated comic books), it is the raw (ungraded, non-slabbed)
comic books which remain the overwhelming majority of comic books in existence,
available for purchase, and sold each year. Price guides such as this one remain
extremely important to the market by providing accurate listings and values for
raw comics, if for no other reason than the immense size of the raw comic
market this guide serves. Slabs represent a very small percentage of all comic
books in existence, however, the slabbed comic market represents a much larger
percentage of total dollars spent annually, particularly for the highest valued
(and highest publicity key issue) comic books in each decade. The largest of
the professional grading companies for comic books has been Certified Guaranty
Company (CGC) since opening to the public in 2000. With CGC permission, I have
been compiling the CGC census into a searchable database online since 2003. If
any other grading companies also make their census information available and
give permission, they will be included in future reports. While there are
billions of comic books in existence, 4,161,087
comic books were reported as having been professionally graded and encapsulated
according to the official CGC census by mid-December 2018. The counts break
out as: 3,405,568 universal grades, 659,200 signature series, 53,488 restored,
and 42,831 qualified grades. Those 4,161,087 slabs are for 179,409 different
comic books, seeming to show that the average comic book sent to CGC has been
graded 23 times. In fact, more than 50,000 different comics have been graded
only once, more than half of the 179,409 comics have been graded three times or
less, and more than 129,000 (72%) of the 179,409 have been graded fewer than
ten times. Only 4% of comic books sent to CGC have been graded at least 100
times. The nine most submitted comic books to date have been graded at least
10,000 times. This might seem like a very high number of copies graded, but
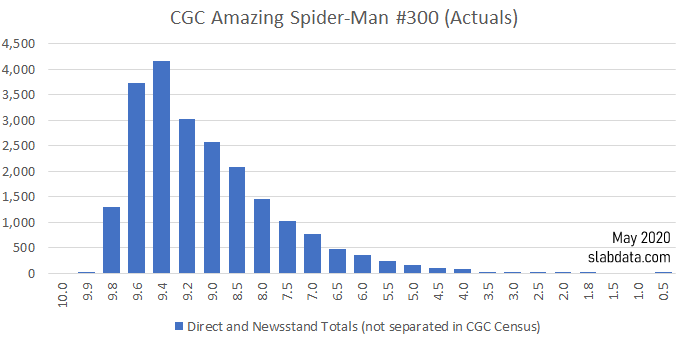
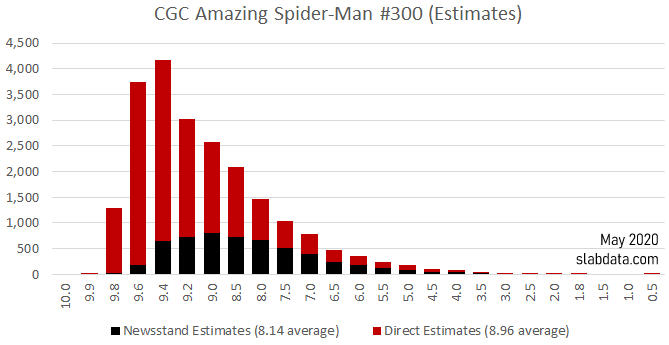
even 10,000 is only 10% if the print run was 100,000 comics. The comics in the top most submitted were printed
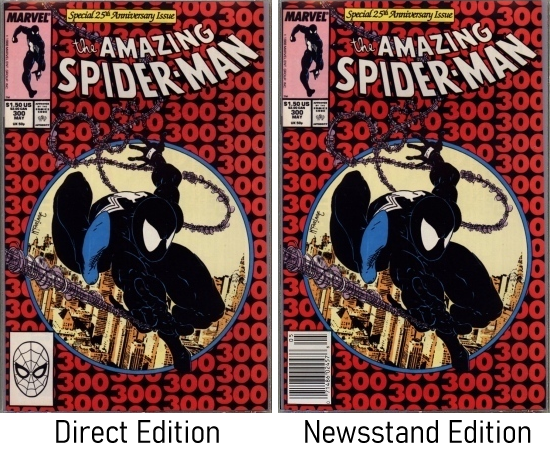
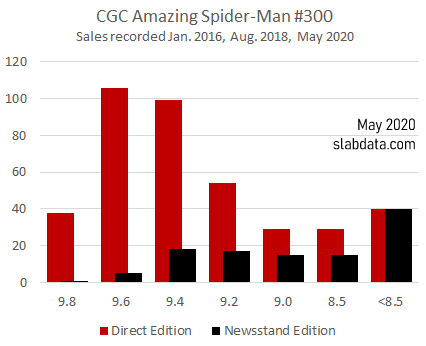
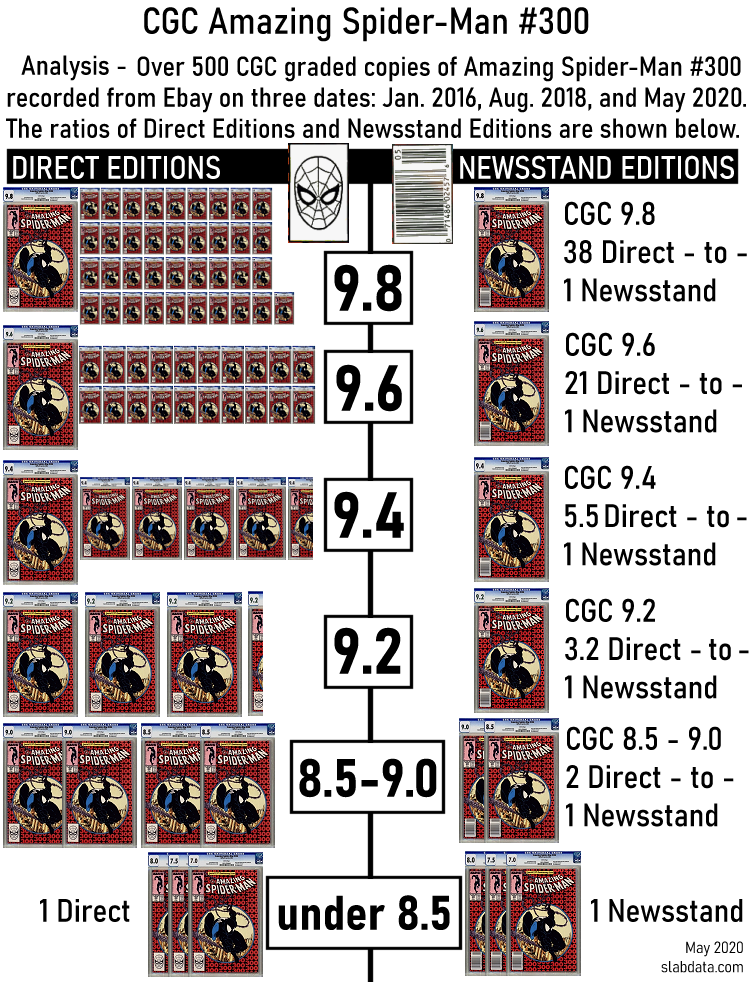
in multiple hundreds of thousands of copies. The most often CGC graded comic book is Amazing Spider-Man #300 with more than 18,000 copies graded,
followed by New Mutants #98, and Wolverine Limited Series #1. The
next five are Marvel Super Heroes Secret
Wars #8, Uncanny X-Men #266, Incredible Hulk #181, Amazing Spider-Man #361, and
Amazing Spider-Man #129. In ninth
place is Spawn #1, followed by Amazing Spider-Man #252 in tenth, which is
likely to exceed 10,000 graded copies by the time of this publication. Nine of the top ten most submitted books are from
Marvel, plus Spawn #1 from Image
Comics. The top most submitted comic
from D.C. Comics is Batman: The Killing
Joke at 17th most submitted with 5,770 copies on the CGC
census. All the Top 100 most-submitted
comics are from Marvel (85), D.C. Comics (11), or Image (4). The first book
represented by another publisher is Rai
#0 (1992) from Valiant Comics at position #101 (2,512 copies graded). The
Top 100 most-submitted books to CGC represent 476,015 copies on the CGC census,
which is 11.4% of all CGC graded comics.
The Top 1% of comics submitted to CGC (1,794 different comics) represent
1,715,163 slabs, or 41% of all slabs.
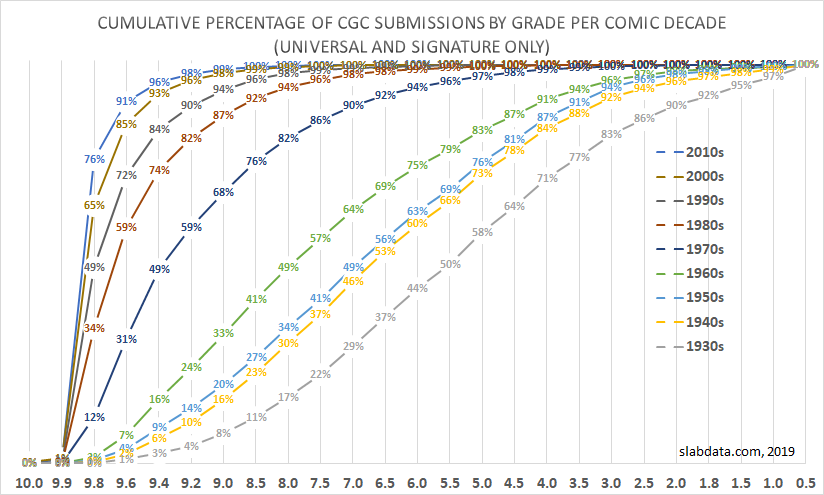
CGC Census Counts by Comic Decade
(as of mid-December 2018):
1930s = 8,254 (0.2%) –
1940s = 138,426 (3.3%) –
1950s = 135,854 (3.3%) –
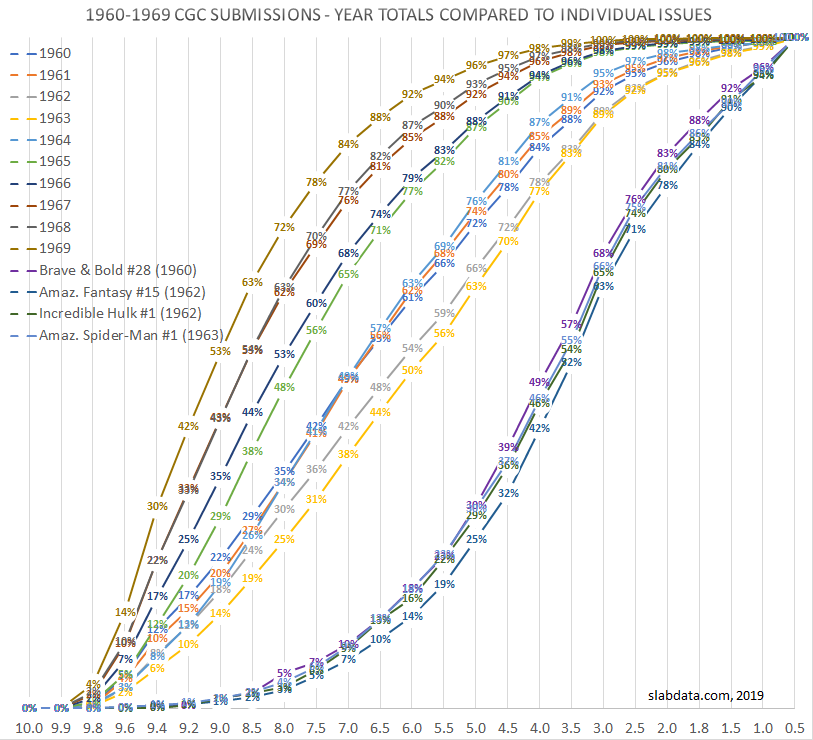
1960s = 656,900 (15.8%) –
1970s = 694,187 (16.7%) –
1980s = 639,429 (15.4%) –
1990s = 472,865 (11.4%) –
2000s = 519,093 (12.5%) –
2010s = 893,984 (21.5%) –
Others = 2,095 (<0.1%) –
Total = 4,161,087.
Drawing broad conclusions using the CGC census information is more
problematic than simply calculating the numbers. CGC counts, totals, and
averages do not necessarily represent a sample of the whole comic book market. Comics which are sent to CGC have often
been selected by the submitter for exceptional qualities of high grade
condition, high market value, or both. By definition, the average raw comic
is unlikely to be exceptional. Another
important note is that comics which have few copies on the CGC census are not
necessarily rare. When a comic book has little market value, even if it is very
old, there is little reason to pay for third-party professional grading and
encapsulation. Comics which appear
uncommon on the CGC census may be extremely common and of little value in the
market. One common phrase often used with CGC graded comics is the phrase
“highest graded”. According to the CGC census, the highest graded copy is
rarely alone. The potential buyer for a highest graded copy should check to see
if the copy is still the highest graded because more copies may be graded at any
time. The buyer should also know if the highest graded copy is one of one, one
of ten, or one of hundreds at the same grade. Over 25% of all CGC graded comics
are also the “highest graded” for that issue. More than 1,000,000 CGC graded comics are technically the “highest
graded” while fewer than 50,000 are the “single highest graded” copy with at
least one lower graded copy on the CGC census. Everyone should be aware
that the phrase “highest graded” rarely means “single highest graded”. Additionally,
any premiums paid for the single highest graded copy of a comic book should be
considered carefully, since another copy at the same grade or higher could potentially
be graded tomorrow. There is also quite a bit of debate and mystery associated
with the highest possible CGC grades of CGC 9.9 and CGC 10. At the time of this writing, CGC had assigned
the CGC 9.9 grade to 15,432 comics (about 1 out of every 270 comics graded) and
assigned the CGC 10 grade to 3,503 comics (about 1 out of every 1,188 comics
graded). The CGC 9.9 and CGC 10 grades are
overwhelmingly associated with recently-printed comic books. 80% of CGC 9.9 and 86% of CGC 10 books were
printed since CGC opened to the public in 2000.
A high percentage of the remaining CGC 9.9 and CGC 10 comics were printed
in the 1990s with chromium wraparound covers. It is common to point to the CGC
9.9 and CGC 10 grades (and their corresponding high prices in the market) as
examples of extremes, even extreme absurdities, but it should be recognized
that CGC 9.9 and CGC 10 are extremely
infrequent, particularly for comics printed in the 1990s and earlier which do
not feature chromium covers. The
oldest CGC 10 comic book is Kolynos
Presents the White Guard #1 (1949), which was a promotional comic book for a
toothpaste company. The oldest standard comic book graded CGC 10 is a copy of Thor #156 (1968). The oldest comic book
graded CGC 9.9 is a copy of Zip Comics #7
(1940). All three of the oldest CGC 9.9
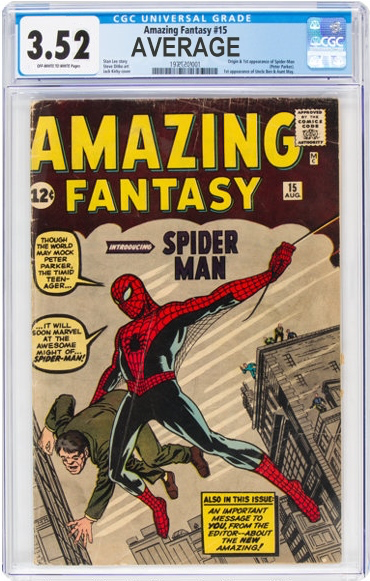
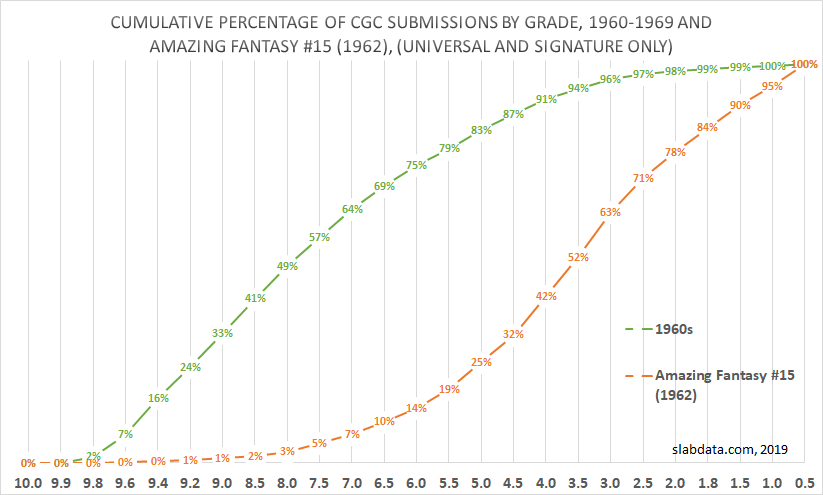
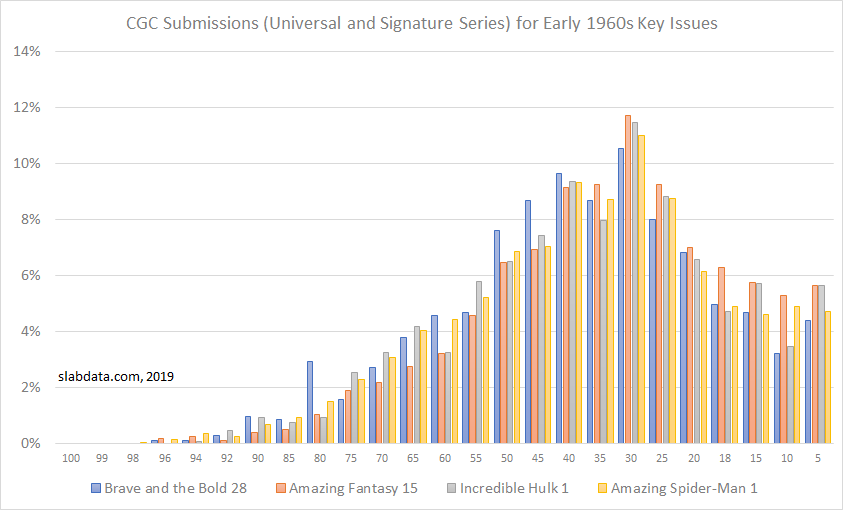
and CGC 10 books listed above were graded by CGC more than 15 years ago. For key issue comics, it is nearly
universally-accepted that the three biggest superheroes in the comic book
industry are Superman, Batman, and Spider-Man, so it is worth noting that CGC
has graded 69 copies of Action Comics #1
(1st Superman, 1938), 68 copies of Detective Comics #27 (1st Batman, 1939), and 3,061
copies of Amazing Fantasy #15 (1st
Spider-Man, 1962). If there were
unreported CGC resubmissions for copies of these (or any other) comic books,
then the CGC census numbers are too high. While this means that the CGC census
has errors, the actual number of CGC slabs in the market (and available for
purchase) is always equal to the number reported or is even lower. More
information like this market report is available at slabdata.com, and more
detailed CGC census analysis can be performed at cgcdata.com.